00
Metrics and campaign evidence
How to read these figures
Source basis: metrics are transcribed from the labelled “Metrics And Results” block on the original Vibra page. The page does not state campaign dates, the DR provider, placement inclusion rules or how Average DR was calculated. No campaign timeframe is claimed here.
| Metric | Source result |
|---|---|
| Campaigns | 01 |
| Placements | 26 |
| Average DR | 63 |
| Highest DR | 94 |
| Increase in DR | 0-25 |
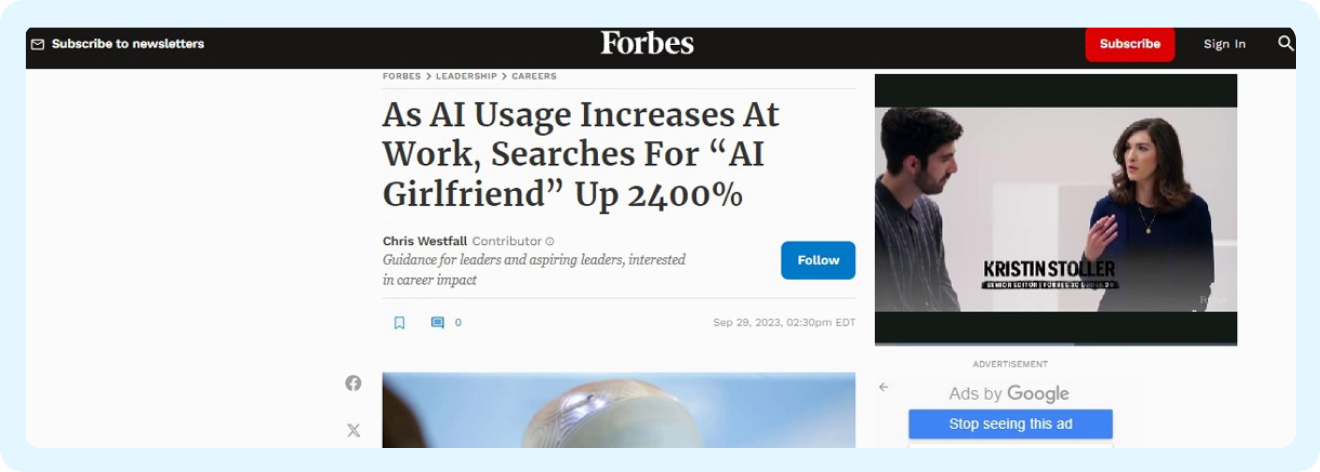
Niche: AI & technology Website type: Directory
01
The challenge
The client wanted an agency they could trust to represent their brand in the media, with a clear focus on results. Search traffic was central to growth, while broader consumer awareness remained an important second objective.
02
The strategy
The team researched how AI was changing different industries and uncovered trend data around adoption and use cases, opening relevant stories to multiple journalist categories.
03
The results
One campaign secured 26 placements with an average DR of 63.